


Diagram
DiagramView draws a graph of shapes and connections: an org chart, a decision tree, a
flowchart, a mindmap. It lays the graph out for you, routes the lines so they meet the real outline of
each shape, and gives you a surface to pan, zoom, select on, drag nodes around and author connections
in.



- MyApp/
1<Project Sdk="Microsoft.NET.Sdk">2 <PropertyGroup>3 <BaseTargetFramework>net10.0</BaseTargetFramework>4 <TargetFrameworks>$(TargetFrameworks);$(BaseTargetFramework)-ios</TargetFrameworks>5 <TargetFrameworks>$(TargetFrameworks);$(BaseTargetFramework)-android</TargetFrameworks>6 <!--useful for unit testing - not enabled by default since it can cause issues and callout projects that don't support target-->7 <!--<TargetFrameworks Condition="'$(CI)' != 'true'">$(TargetFrameworks);$(BaseTargetFramework)</TargetFrameworks>-->8 9 <RootNamespace>MyApp</RootNamespace>10 <SingleProject>true</SingleProject>11 <ImplicitUsings>enable</ImplicitUsings>12 <Nullable>enable</Nullable>13 <ApplicationTitle>MyApp</ApplicationTitle>14 <ApplicationId>com.companyname.app</ApplicationId>15 <ApplicationDisplayVersion>1.0</ApplicationDisplayVersion>16 <ApplicationVersion>1</ApplicationVersion>17 18 <MauiXamlInflator>SourceGen</MauiXamlInflator>19 <!--uncomment below for XAML expressions in net10-->20 <!--<EnablePreviewFeatures>true</EnablePreviewFeatures>-->2122 <MauiVersion>10.0.110</MauiVersion>23 <ShinyVersion>6.3.0</ShinyVersion>24 <ShinyControlsVersion>1.8.0-beta-0004</ShinyControlsVersion>25 <ShinyShellVersion>7.0.3</ShinyShellVersion>26 <ShinyDocumentDbVersion>14.1.0</ShinyDocumentDbVersion>27 <ShinyExtensionsVersion>6.0.1</ShinyExtensionsVersion>28 <ShinyHttpServerVersion>2.2.0</ShinyHttpServerVersion>29 <ShinySpeechVersion>3.0.0-beta-0030</ShinySpeechVersion>30 <ShinyHealthVersion>2.0.1</ShinyHealthVersion>31 <ShinyMusicVersion>4.1.0</ShinyMusicVersion>32 <ShinyObdVersion>1.4.0</ShinyObdVersion>33 <ShinyRecognitionVersion>1.0.0-beta-0006</ShinyRecognitionVersion>3435 <EnableAotAnalyzer>true</EnableAotAnalyzer>36 <EnableTrimAnalyzer>true</EnableTrimAnalyzer>37 <EnableSingleFileAnalyzer>true</EnableSingleFileAnalyzer>3839 </PropertyGroup>4041 <!-- If you want to enable AOT for iOS, uncomment the below. Note that this will cause a significant increase in build time, but will result in faster runtime performance and smaller app size. You can also enable it for just Release builds if you prefer.42 <PropertyGroup Condition="$([MSBuild]::GetTargetPlatformIdentifier('$(TargetFramework)')) == 'ios' and '$(Configuration)' == 'Release'">43 <PublishAot>true</PublishAot>44 </PropertyGroup>45 -->4647 <PropertyGroup Condition="'$(TargetFramework)' != '$(BaseTargetFramework)'">48 <OutputType>Exe</OutputType>49 <UseMaui>true</UseMaui>50 <DefineConstants>$(DefineConstants);PLATFORM</DefineConstants>51 </PropertyGroup>5253 <PropertyGroup Condition="'$(TargetFramework)' == '$(BaseTargetFramework)'">54 <OutputType>Library</OutputType>55 <UseMaui>false</UseMaui>56 </PropertyGroup>5758 <PropertyGroup Condition="$([MSBuild]::GetTargetPlatformIdentifier('$(TargetFramework)')) == 'android'">59 <SupportedOSPlatformVersion>26.0</SupportedOSPlatformVersion>60 <TargetPlatformVersion>36</TargetPlatformVersion>61 <!--62 <EmbedAssembliesIntoApk Condition="'$(Configuration)' == 'Debug'">true</EmbedAssembliesIntoApk>63 <AndroidPackageFormats Condition="'$(Configuration)' == 'Release'">aab</AndroidPackageFormats>64 <AndroidLinkTool>r8</AndroidLinkTool>65 <AndroidLinkTool>proguard</AndroidLinkTool>66 -->67 </PropertyGroup>6869 <PropertyGroup Condition="$([MSBuild]::GetTargetPlatformIdentifier('$(TargetFramework)')) == 'ios' AND '$(Configuration)' == 'Debug'">70 <!--forces the simulator to pickup entitlements-->71 <EnableCodeSigning>true</EnableCodeSigning>72 <CodesignRequireProvisioningProfile>true</CodesignRequireProvisioningProfile>73 <DisableCodesignVerification>true</DisableCodesignVerification>74 </PropertyGroup>7576 <PropertyGroup Condition="$([MSBuild]::GetTargetPlatformIdentifier('$(TargetFramework)')) == 'ios' OR $([MSBuild]::GetTargetPlatformIdentifier('$(TargetFramework)')) == 'maccatalyst'">77 <SupportedOSPlatformVersion>15.0</SupportedOSPlatformVersion>78 <DefineConstants>$(DefineConstants);APPLE</DefineConstants> 79 </PropertyGroup>8081 <ItemGroup Condition="$([MSBuild]::GetTargetPlatformIdentifier('$(TargetFramework)')) == 'ios' OR $([MSBuild]::GetTargetPlatformIdentifier('$(TargetFramework)')) == 'maccatalyst'">82 <BundleResource Include="Platforms\iOS\PrivacyInfo.xcprivacy" LogicalName="PrivacyInfo.xcprivacy" />83 84 <CustomEntitlements Include="keychain-access-groups" Type="StringArray" Value="%24(AppIdentifierPrefix)$(ApplicationId)" Visible="false" />85 </ItemGroup>8687 <ItemGroup>88 <TrimmerRootDescriptor Include="Linker.xml" Condition="'$(Configuration)' == 'Release'" />8990 <MauiIcon Include="Resources\AppIcon\appicon.svg" ForegroundFile="Resources\AppIcon\appiconfg.svg" Color="#512BD4" />91 <MauiSplashScreen Include="Resources\Splash\splash.svg" Color="#512BD4" BaseSize="128,128" />9293 <MauiImage Include="Resources\Images\*" />94 <MauiFont Include="Resources\Fonts\*" />95 <MauiAsset Include="Resources\Raw\**" LogicalName="%(RecursiveDir)%(Filename)%(Extension)" />96 </ItemGroup>9798 <ItemGroup>99 <PackageReference Include="Shiny.Maui.Controls.Diagram" Version="$(ShinyControlsVersion)" />100 <!-- always referenced directly: BaseServices & friends are registered by its [Singleton]/[Scoped] source generator -->101 <PackageReference Include="Shiny.Extensions.DependencyInjection" Version="$(ShinyExtensionsVersion)" />102 <PackageReference Include="Microsoft.Maui.Controls" Version="$(MauiVersion)" />103 <PackageReference Include="Microsoft.Extensions.Logging.Debug" Version="10.0.13" Condition="'$(Configuration)' == 'Debug'" />104 </ItemGroup>105106 <ItemGroup Condition="'$(TargetFramework)' != '$(BaseTargetFramework)'">107 <PackageReference Include="Shiny.Hosting.Maui" Version="$(ShinyVersion)" />108 </ItemGroup>109110</Project>MAUI
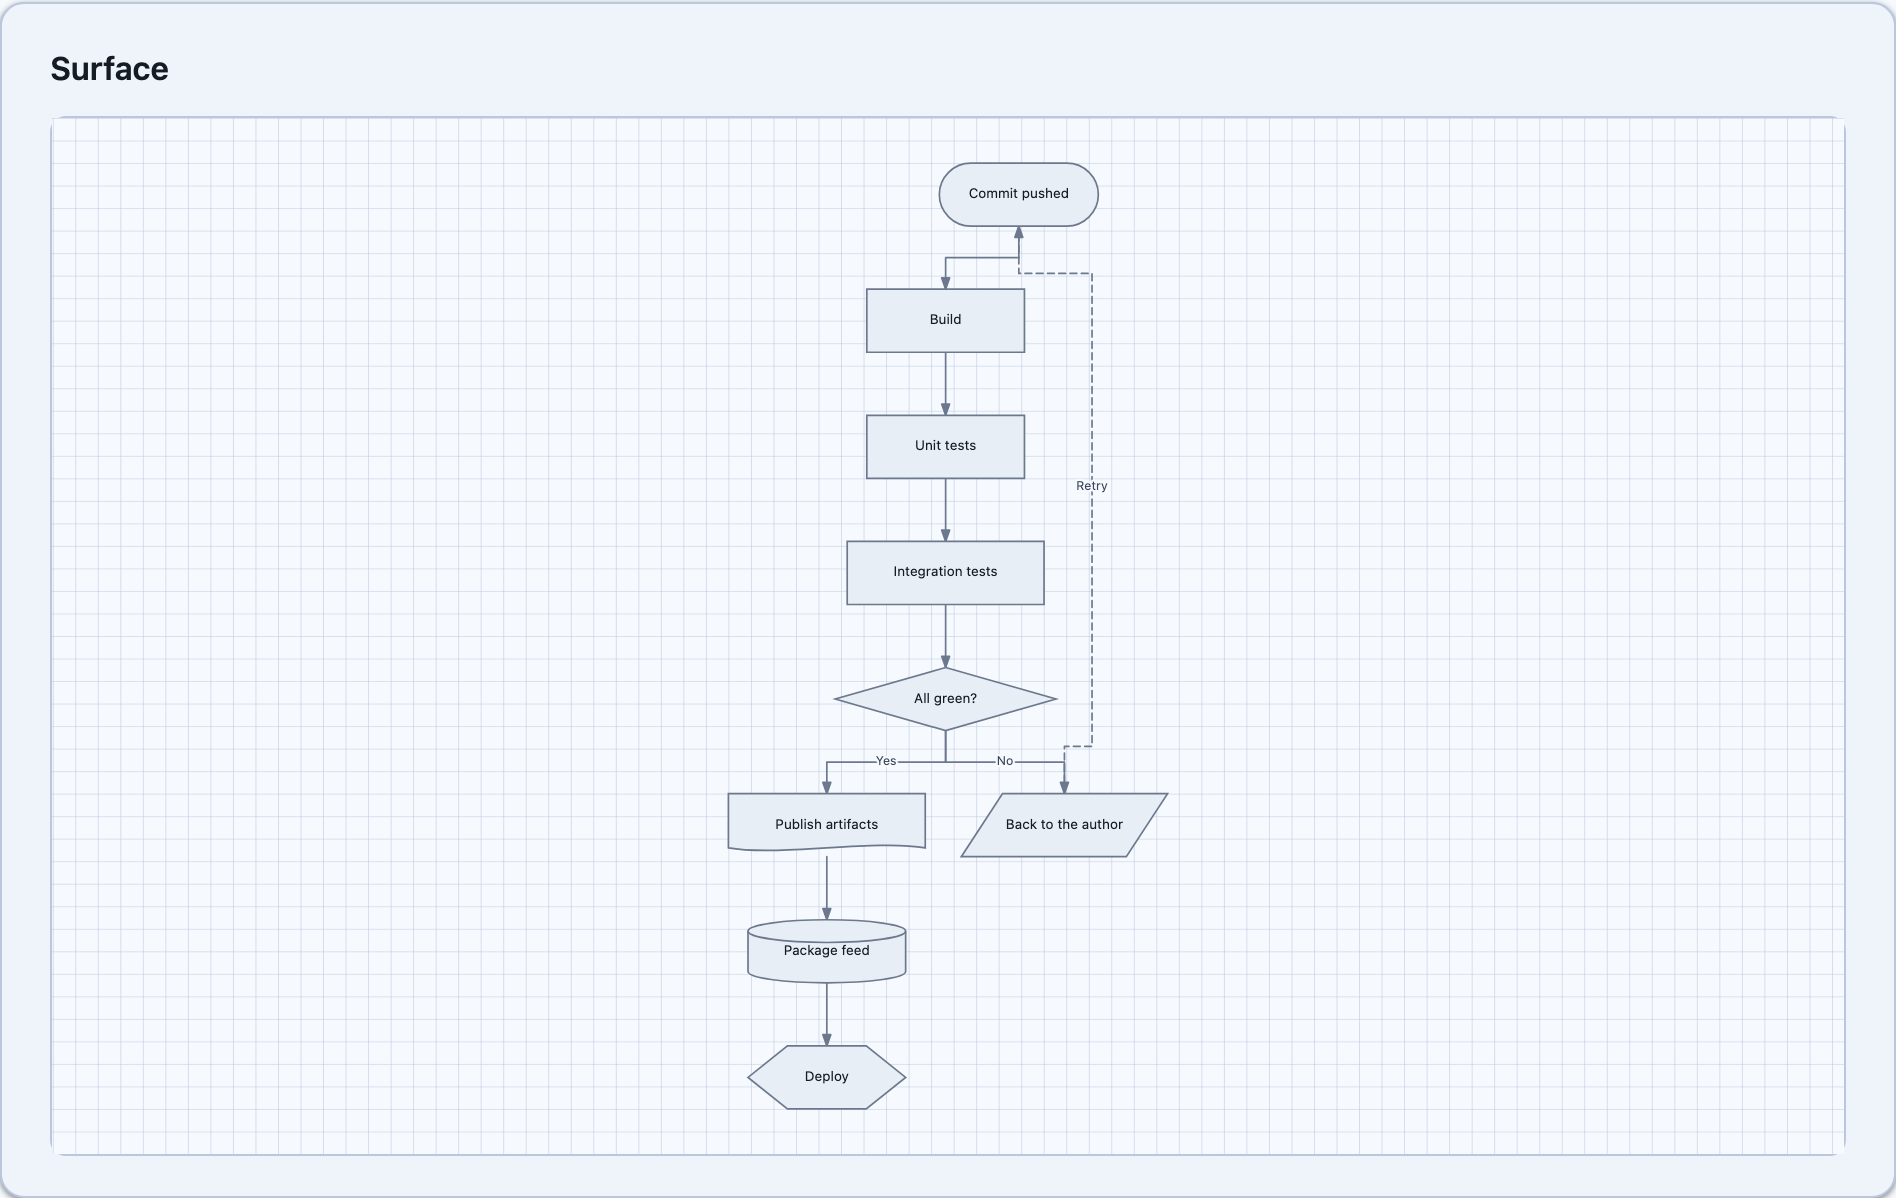
| Decision tree | Flowchart with a retry loop |
|---|---|
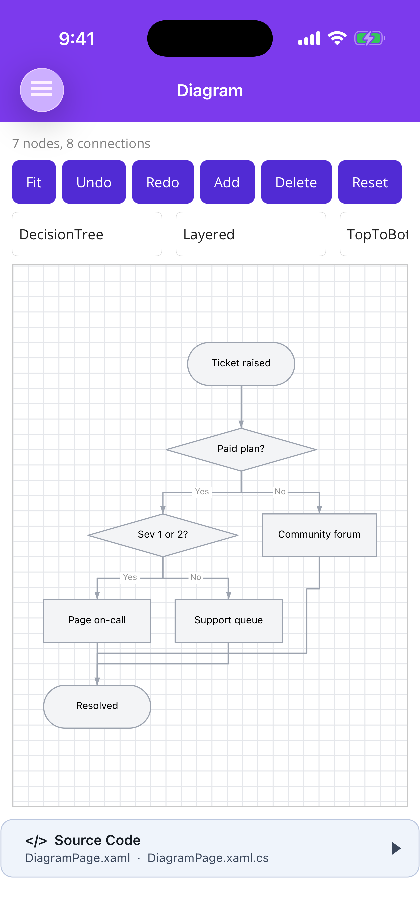 |
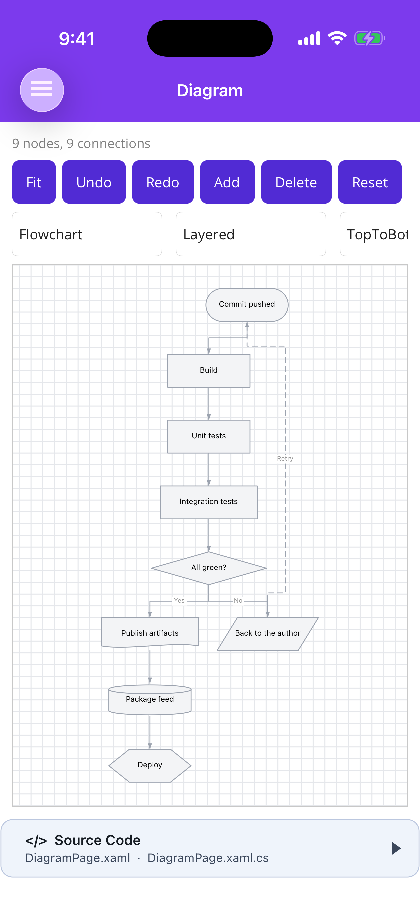 |
Blazor
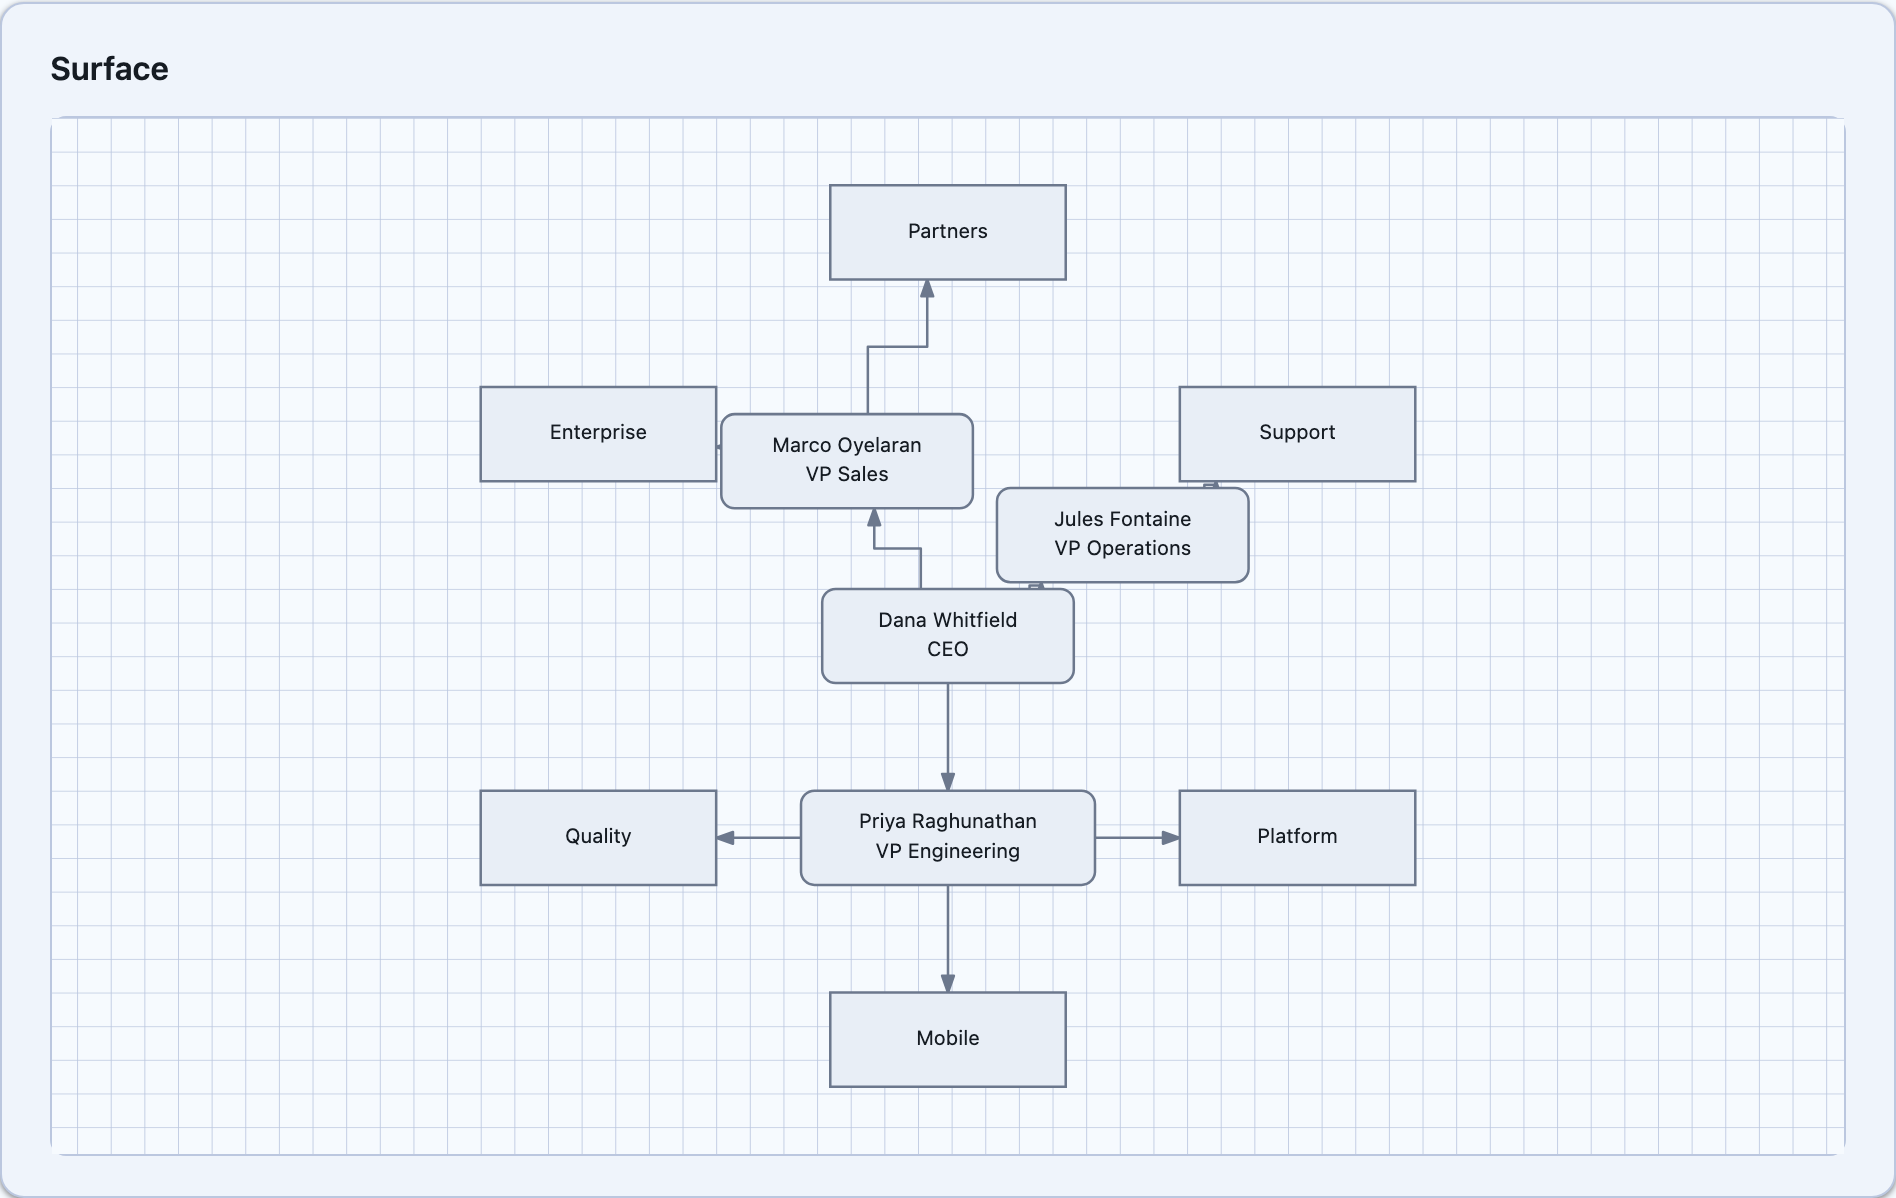
| Mind map | Org chart |
|---|---|
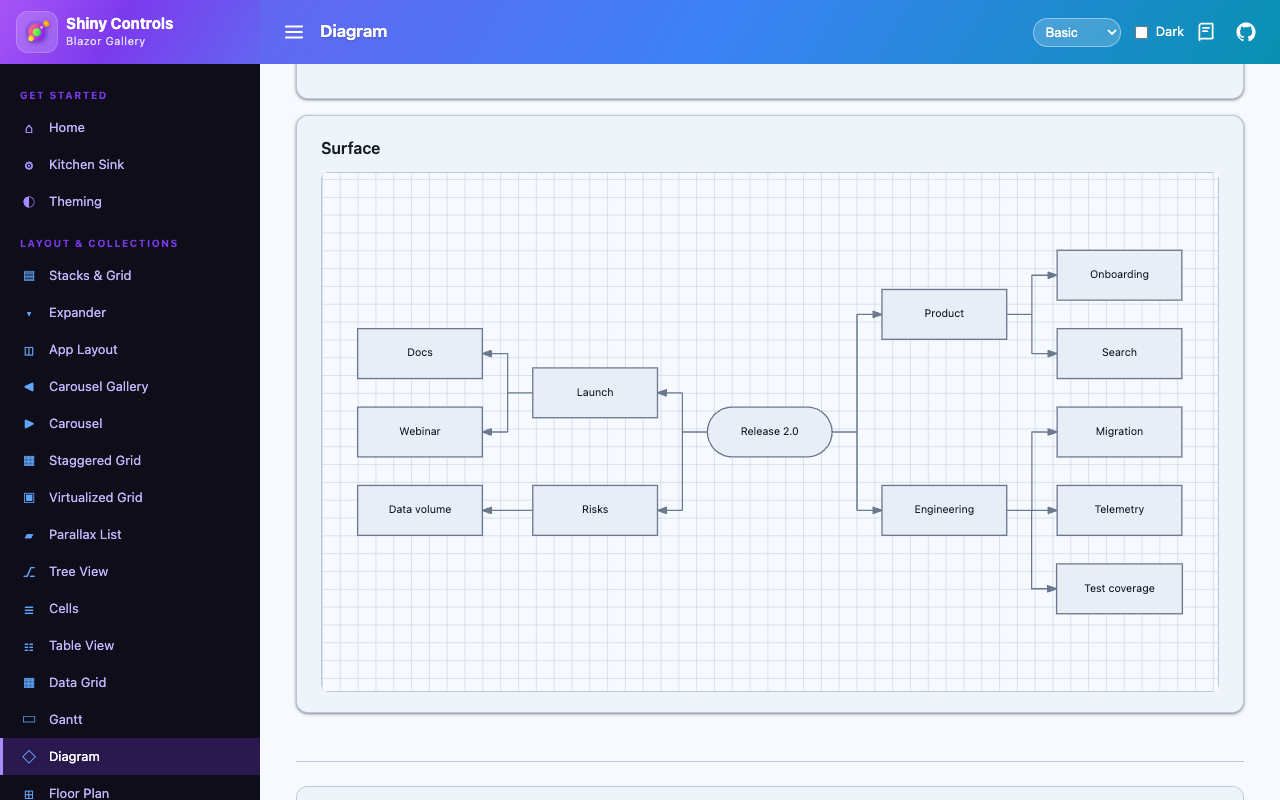 |
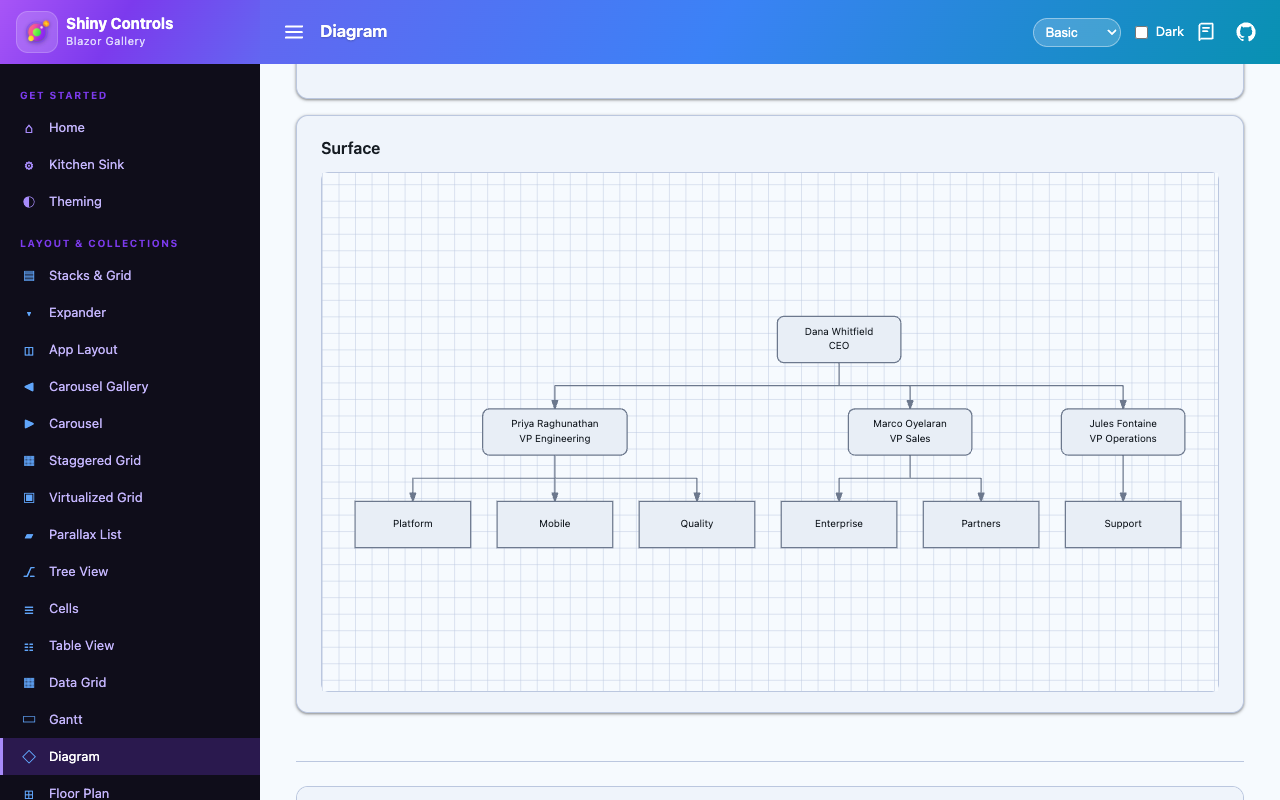 |
| Layered | Radial | Force-directed |
|---|---|---|
 |
 |
 |
Not the Mermaid control
Section titled “Not the Mermaid control”Mermaid Diagrams renders a picture from mermaid text. This renders a graph you bind to and edit. If your source of truth is markup, use Mermaid; if it is a collection of nodes — rows from a database, a view model — use this one.
One engine, two hosts
Section titled “One engine, two hosts”A diagram is mostly arithmetic. Packing a tidy tree so a parent sits centred over its children and no
two subtrees collide, assigning layers to a graph that loops back on itself, working out where a line
leaving a diamond actually crosses its edge — none of it wants to know whether it is drawing into a
MAUI canvas or an SVG viewBox.
So it doesn’t. Shiny.Controls.Diagram.Shared owns the model, all five layouts, the connector
routing and the shape geometry — down to the exact box every node occupies and the exact polyline
every connection follows. Both controls are thin: they turn gestures into a DiagramEditPlan and
paint what the engine tells them to.
A layout that resolved differently on the two hosts would be a bug neither host’s own tests would notice, and this removes the possibility rather than testing for it. The package is dependency-free, trimmable and AOT-clean, and is perfectly usable with no UI at all.
Getting started
Section titled “Getting started”dotnet add package Shiny.Maui.Controls.Diagram# ordotnet add package Shiny.Blazor.Controls.Diagramusing Shiny.Controls.Diagramming;
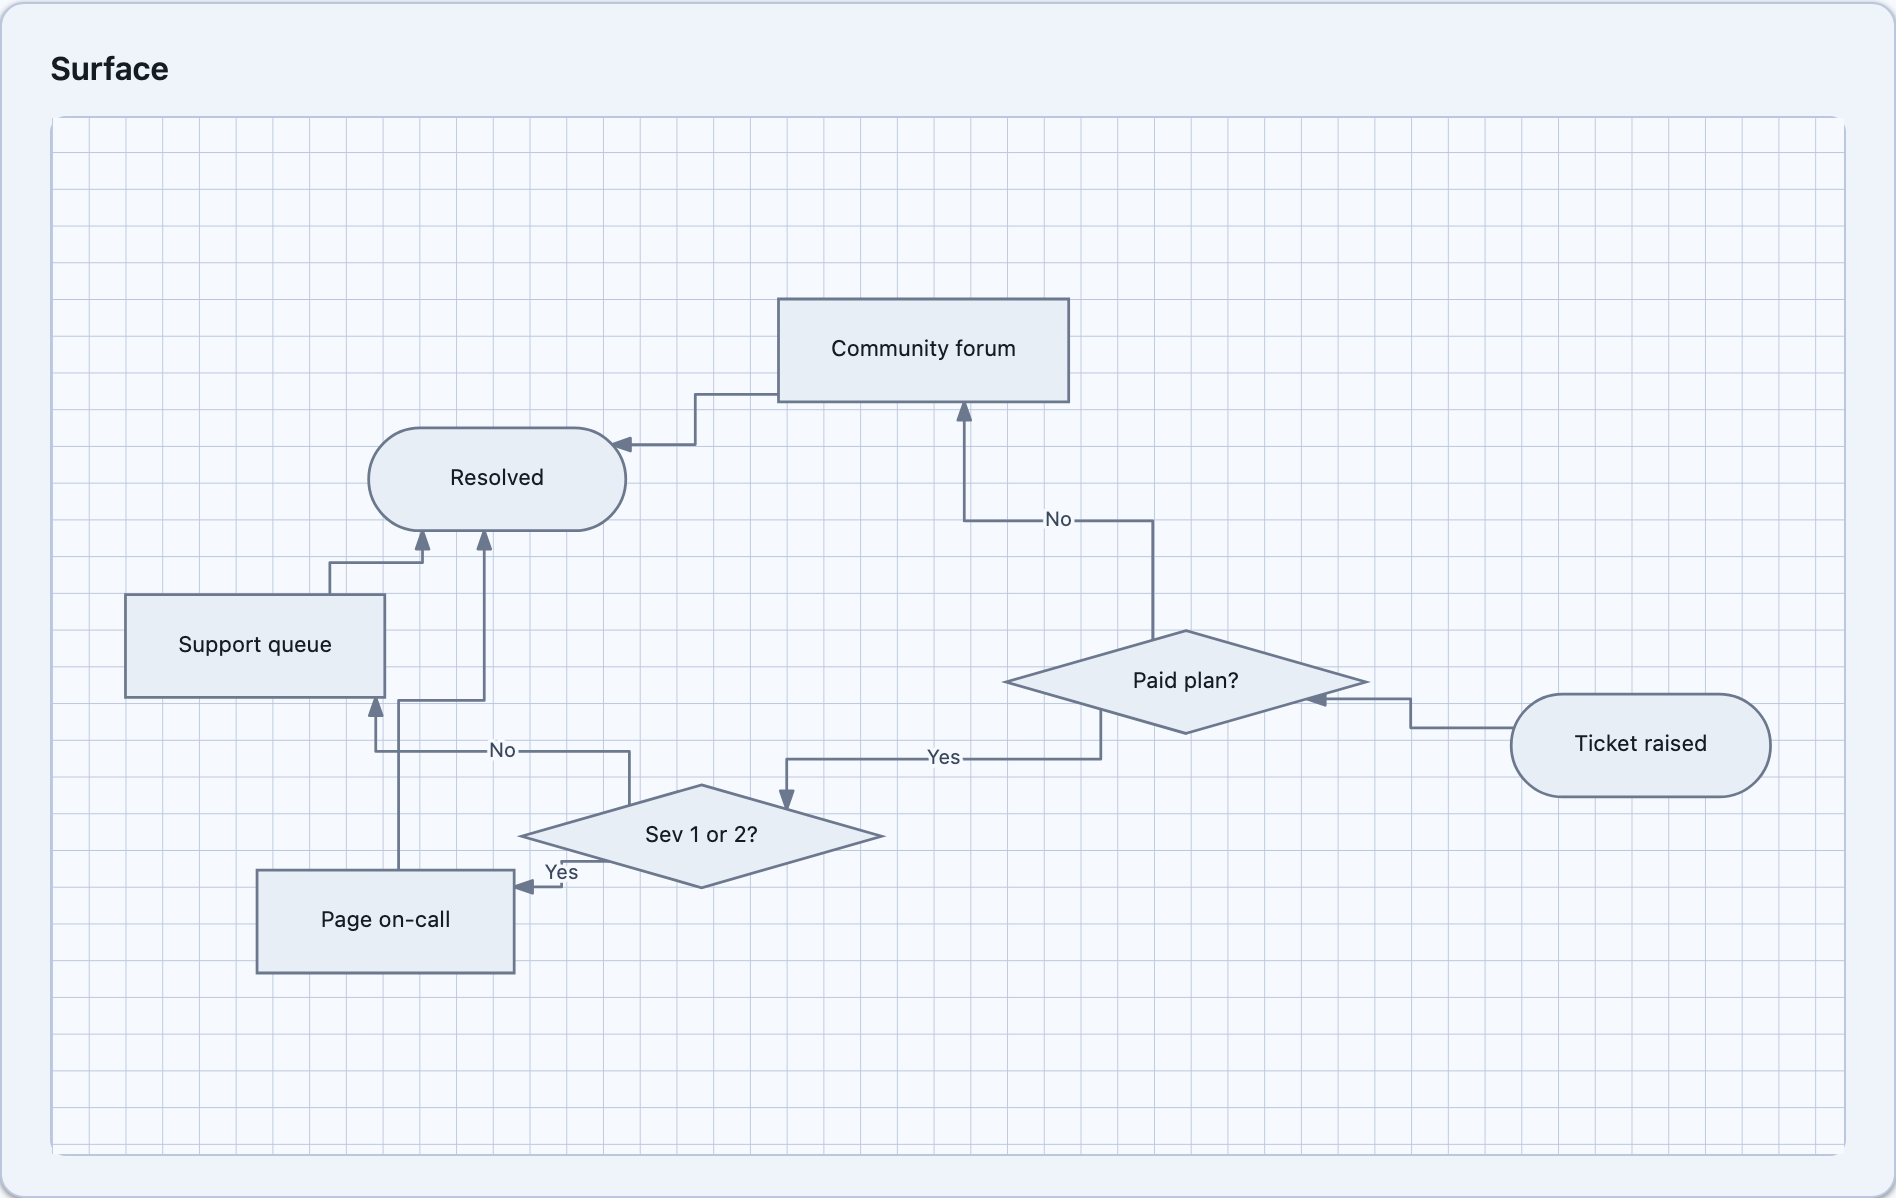
var nodes = new ObservableCollection<DiagramNode>{ new("start", "Ticket raised") { Shape = DiagramNodeShape.Stadium }, new("paid", "Paid plan?") { Shape = DiagramNodeShape.Diamond }, new("queue", "Support queue"), new("forum", "Community forum")};
var connections = new ObservableCollection<DiagramConnection>{ new("start", "paid"), new("paid", "queue", "Yes"), new("paid", "forum", "No")};<shiny:DiagramView Nodes="{Binding Nodes}" Connections="{Binding Connections}" LayoutKind="Layered" AllowNodeDrag="True" AllowConnectionEdit="True" /><div style="height:520px"> <DiagramView Nodes="nodes" Connections="connections" LayoutKind="DiagramLayoutKind.Layered" AllowNodeDrag="true" AllowConnectionEdit="true" /></div>The Blazor component fills its parent and needs a bounded height, the same as GanttView.
The model
Section titled “The model”Nodes are DiagramNode, connections are DiagramConnection — concrete types rather than a generic
TItem, because the engine writes layout results back onto them. Put your own object in
DiagramNode.Item and bind a template to it.
Both collections are watched. An ObservableCollection redraws on add and remove, and every node and
connection is watched for property changes, so editing the source redraws without calling anything.
Hierarchy, either way round
Section titled “Hierarchy, either way round”Nest nodes in Children and the parent link maintains itself; or hand over a flat list where each
node carries a ParentId and the model reassembles the tree. Mixing the two is fine. Charts arrive
from a database as rows and from a view model as a tree, and forcing a conversion on the consumer is
how a control ends up with two half-supported paths.
A hierarchy with no connections of its own still draws its links. An org chart handed over as nested nodes has parents and children and no edges; without this it would draw as a tidy grid of boxes joined by nothing, which looks like the control failed rather than like a deliberate absence. Declaring a connection between the same two nodes replaces the implicit one — that is how you add a label or a different arrowhead.
Shapes, and why the outline matters
Section titled “Shapes, and why the outline matters”DiagramNodeShape is the flowchart vocabulary rather than a general shape library: Rectangle,
RoundedRectangle, Stadium, Circle, Ellipse, Diamond, Parallelogram, Hexagon, Cylinder,
Document, Triangle. Each one means something to a reader of a flowchart.
Anchoring and hit testing both work against the real outline, not the bounding box. That single detail is most of what makes a decision tree look drawn rather than approximated: with a box anchor, every arrow into a diamond stops short in mid-air at the corner of an invisible rectangle, and a click in that same empty corner selects the node.
Validation reports, it does not throw
Section titled “Validation reports, it does not throw”Real data routinely contains a dangling connection, a duplicate id or a parent chain that loops. A
control that threw on one would be unusable against it, and one that silently dropped it would be
worse — so the diagram still draws and DiagramModel.Issues says what was wrong. Read it from the
Built event (MAUI) or OnBuilt (Blazor), because nothing else will tell you.
Saving
Section titled “Saving”DiagramJson.Save and DiagramJson.Load round-trip the graph, the shapes and hand-placed positions
through a flat pair of lists. Routes, depths and selection are not saved — they are derived on the
next rebuild, so saving them would only create the possibility of a file disagreeing with itself.
Serialization is source-generated, so it survives a trimmed WebAssembly publish.
Load into LayoutKind = None to keep the saved positions.
- Layouts — the five arrangements and when each is the right one
- Editing & Undo — plans, cancellation and the undo stack